Driving my son, Jett, to Boy Scouts last week, he piped up from the backseat to ask, “Dad, what’s inflation?”
This is a boy who normally is only concerned with how high he can double bounce his siblings on the trampoline in the backyard, so to say I was shocked that he was asking this is an understatement. Perhaps I shouldn’t have been surprised, though. This seems to be a topic on every American’s mind these days.
Over the last few weeks, more and more clients are raising questions about rising inflation, the supply chain, the definition of ‘transitory’, and so on. The anxiety is real, and it’s growing. The University of Michigan Consumer Sentiment Index, which is a monthly survey of consumer confidence, was lower in November of 2021 than it was in March, April, and May of 2020 (the peak of COVID-19 shutdowns). In fact, the last time consumer sentiment was this low was at the end of 2011 during the European Sovereign Debt crisis.
Just the word ‘inflation’ bubbles up fearful visions of the 1970s with angry people waiting in gas lines proudly displaying, “Carter, Kiss My Gas” bumper stickers on their cars. I’m not here to encourage additional ‘Biden Blame,’ but it’s not surprising to see his latest job approval rating at 36%.
As of November, consumer prices (measured by the Consumer Price Index aka CPI) are up 6.8% over the last twelve months. To put things in perspective, that is the highest year over year percentage increase in 40 years, with the primary drivers being Food, Oil, Gas and New & Used Cars / Trucks highlighted below:
- +6.4% on Food at home (+12.8% on meat, poultry, fish and eggs)
- +33.3% on Energy (+59.3% on fuel oil, +58.1% on gasoline, +25.1% on natural gas)
- +11.1% on New Vehicles
- +31.4% on Used Cars & Trucks
As these costs add up at the household level, they become increasingly painful as purchasing power erodes. If you were filling up your car with 20 gallons of gas once every two weeks a year ago it used to cost about $40.00 at $2.00/gallon. The cost today is approximately $65.00 at $3.25/gallon. That’s an extra $50 per month.
Throw on more expensive groceries plus home utilities and seemingly out of nowhere you may have to start sacrificing or downsizing your fun purchases like a new pair of shoes, Peloton, or beach trip, in favor of more necessity-based spending like your electricity bill or braces for your daughter. That’s a troubling trend.
The highest peak twelve-month inflationary increases since 1960 were:
- 6.4% on February 1970
- 12.2% on November 1974
- 14.6% on April 1980
- 6.4% on October 1990
- 5.5% on July 2008
- 6.8% on November 2021
So, it is possible for inflation to run higher than it is running today, but is it probable?
Let’s use oil as an example. The price of a barrel of oil is up about 60% from a year ago at approximately $72/barrel today. Do I think a year from now oil will be up another 60% at $115/barrel? It’s possible, but probably not.
Let’s go back to April of 2020, when we shut down the entire country (no planes in the air, no cars on the road, literally a zombie apocalypse… Think of Will Smith in the movie, “I Am Legend”). On April 19, 2020, the price for the immediate delivery (spot price) of West Texas Intermediate crude oil (WTI) went negative all the way down to -$37/barrel during the trading day. Which means on this day in our very recent history someone would have paid you $37 to store a barrel of oil in your garage!
But now, a mere 19 months later, there is an oil shortage and President Biden is releasing 50 million barrels from the Strategic Petroleum Reserve and encouraging China to do the same? C’mon Man…
Maybe that’s just one example of pent-up demand unfolding in front of us as more and more people start to feel comfortable traveling, attending live concerts, and all those other fun activities we took for granted in 2019. While we’re reopening the world, travel, leisure, and hospitality companies are struggling to ramp their operations back to pre-pandemic levels.
The global economy is still very fragile.
COVID cases are rising in Europe again. Austria is reimposing a full national lockdown. Neighboring Germany announced a lockdown for the unvaccinated and is discussing plans for mandatory vaccinations. Tack on a few more countries, shutdown a port in Shanghai, and here we go again?
The United States (laggard) has followed Europe (leader) since agencies started tracking new COVID cases in early 2020. It’s important to remain watchful. It may feel like COVID is in the rearview mirror. We certainly are better equipped to deal with it than we were less than 24 months ago, but the shark is still in the water.
So, if this is where we are with no immediate end in sight, how do we approach investing in an inflationary environment? The answer is mindfully.
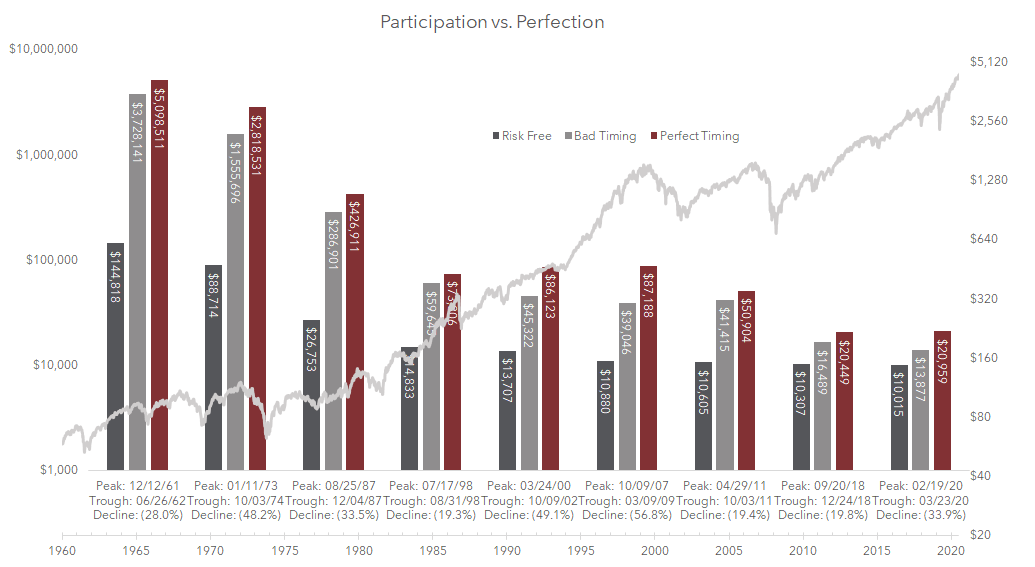
Our approach is based on two separate concepts…Participation vs. Perfection (Chart 1) and Historical Market Performance (Chart 2).
In Chapter 11 of What the Happiest Retirees Know, we took the five largest market corrections since 1990 and calculated the return on what happened if someone invested $10,000 in the S&P 500 at the best possible time (at the bottom of each correction), the worst possible time (at the market peak preceding each correction) or just simply stayed in cash (invested the $10,000 in 3-month treasury bills). For this article, we expanded that chart from January 1960 through November 2021 to capture the hyperinflationary periods of the 1970s and 1980s.
During each of the nine significant market corrections varying in magnitude from -19% to -57%, investing in stocks beat cash. Every. Single. Time. That even includes if you invested at the worst possible moment (at the market peak).
Chart 1

S&P 500 data sourced from Bloomberg
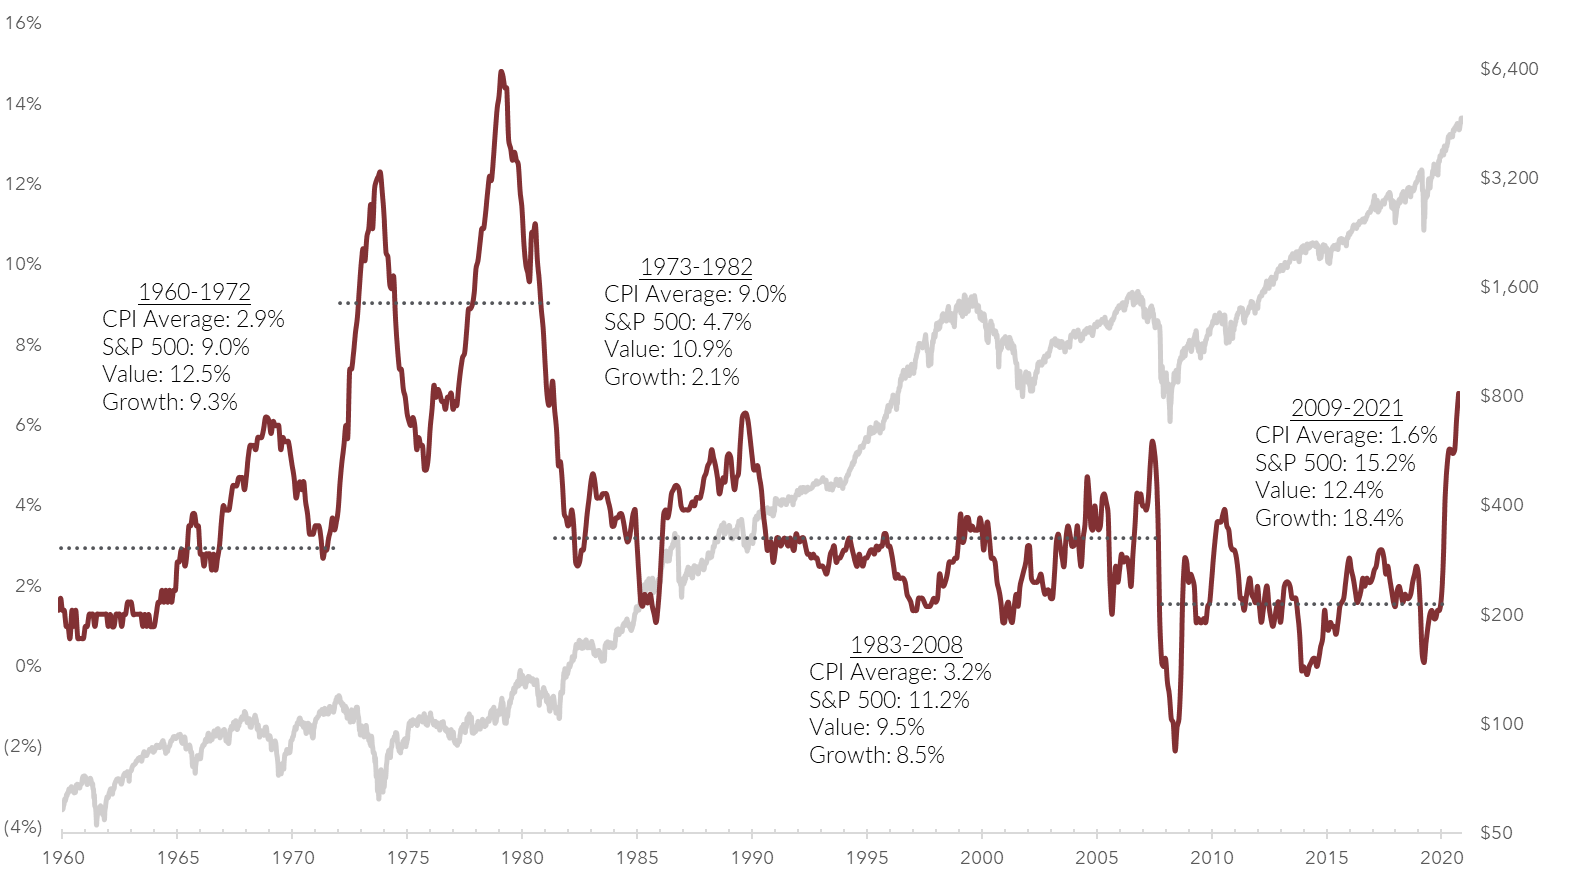
So, if I’m going to choose participation over perfection, how should I invest? Let’s review the Historical Market Performance in Chart 2 below.
Chart 2

Chart 2 uses the same period as Chart 1 (January 1960 through November 2021), but breaks this timeline down into four separate blocks and relates the Consumer Price Index (CPI) to S&P 500 performance:
- 1960 to 1972: Lyndon B. to Tricky Dick
- 1973 to 1982: Carter to Reagan
- 1983 to 2008: Bush to Slick Willy to “Dub”
- 2009 to 2021: Obama (& Biden) to DJT to Biden
From 1960 to 1972, inflation averaged 2.9% and the S&P 500 averaged 9%. Within the S&P 500, value stocks (Russell 1000 Value) averaged 12.5% while growth stocks (Russell 1000 Growth) averaged 9.3%.
1983 to 2008 looks similar in terms of inflation and market returns. Following the 2007 financial crisis, from 2009 to 2021, inflation fell with CPI averaging 1.6% and the market caught fire with the S&P 500 averaging just over 15% per year and growth stocks outperforming value stocks by 6% annually.
But take look at what happened from 1973 to 1982 when inflation averaged 9%. The S&P 500 averaged 4.7% (less than inflation), growth stocks even lower at 2.1% while value stocks averaged 10.9%.
Now let’s dig into some specific investment decisions. I’m not making an absolute statement that you should sell everything in your portfolio and buy dividend-paying value stocks. However, I am pointing out that the Russell 1000 Value Index outperformed the Russell 1000 Growth Index, the S&P 500, and CPI during the highest inflationary period in the last 50 years.
Why? A few reasons come to mind:
- Demand Elasticity vs. Inelasticity: Value companies tend to provide products and services that are more inelastic whereas growth companies are more elastic. Demand elasticity vs inelasticity refers to the degree to which demand responds to a change in price, income level or substitution. Think of this as the “Must Haves” vs “Nice To Haves” when making purchasing decisions. Items like groceries, phone, utilities, gas, medical are in the inelastic camp (aka Must Haves) which means there isn’t much of a change in demand when the price increases. Versus a steak dinner, fancy trip, new car? These are in the elastic camp (aka Nice To Haves) which means there is a substantial change in demand for a product or service when price increases.
- Pricing Power: Inelastic companies have more pricing power which means that if their expenses increase due to inflation, they can pass these costs to the consumer by raising the price of their goods/services.
- Inflation & Valuation: As inflation rises, the valuation of growth companies tends to be more negatively impacted than value The impact of inflation and higher interest rates on valuations can be a nuanced subject and this article is not the place to explore the depths of the discounted cash flow model. That said, it’s worth understanding the basic impacts these factors can have on traditional growth and value companies.
An easy way to think about this is that inflation makes future dollars less valuable. If a $10 meal rises in price (inflates) by 6%, it now costs $10.60. Not terrible. But now do that 10 times and the cost of the original meal nearly doubles to $18!
How does this apply to the valuation of growth and value companies? Well, growth companies tend to earn less dollars today because they reinvest most of their present earnings back into their businesses thereby placing a greater priority on maximizing their future earnings (aka future dollars). Value companies, on the other hand, tend to place greater focus on maximizing their present earnings (aka today dollars) and less on reinvestment for amplifying future earnings. So, if inflation causes future dollars to be less valuable and growth companies tend to earn the majority of their money in the future the issue becomes more clear.
While we don’t know exactly how long the current inflationary period will last, we can get through it by remaining mindful and taking some comfort in the fact that it isn’t permanent (nothing is).
Take a page out of my son’s book and put your focus back on your double bounces on the trampoline. But, if the “I-word” is keeping you up at night, consider working with a trusted, qualified financial planner to discuss how to customize your investment portfolio to better keep up with inflationary pressures.
Sources
CNBC – Is not getting a 6% raise amid inflation actually taking a pay cut?
US Bureau of Labor Statistics CPI Index
This information is provided to you as a resource for informational purposes only and should not be viewed as investment advice or recommendations. Investing involves risk, including the possible loss of principal. There is no guarantee offered that investment return, yield, or performance will be achieved. There will be periods of performance fluctuations, including periods of negative returns. Past performance is not indicative of future results when considering any investment vehicle. This information is being presented without consideration of the investment objectives, risk tolerance, or financial circumstances of any specific investor and might not be suitable for all investors. This information is not intended to, and should not, form a primary basis for any investment decision that you may make. Always consult your own legal, tax, or investment advisor before making any investment/tax/estate/financial planning considerations or decisions.

